


North Carolina has released school performance data for both Buncombe County and Asheville City schools.
The North Carolina General Assembly requires that all schools to be graded from an A to an F each school year. This legislation requires that school performance grades are based 80-percent on the school’s achievement score and 20-percent on the students’ academic growth.
All Buncombe County high schools earned a school performance grade of C or higher, and 91% of Buncombe County elementary, intermediate, and middle schools achieved a grade of C or better. Only one Asheville City School earned a school performance grade below C.
Find out more via the Asheville City Schools and Buncombe County Schools press releases.
Asheville City Schools press release:
September 2, 2015
Asheville City SchoolsNorth Carolina Releases School Performance Data for 2014-15; mixed results for Asheville City Schools
Students grades 3-8 in Asheville City Schools outperformed their state counterparts in 2014-15 grade level proficiency in both reading (65.8% vs. 56.3%) and math (62.4% vs. 52.2%); the School of Inquiry and Life Sciences at Asheville (SILSA) earned a School Performance Grade (SPG) ‘A’ by posting high marks on all five high school accountability measures, while six other schools received a ‘B’ or ‘C’; and the district’s four-year graduation rate matched the state’s highest rate ever, 85.4%. However, the student growth component declined for Asheville City Schools (as it did statewide) and four ACS schools did not meet expected growth, compared to just one in 2013-14. Year-round pilot school, Hall Fletcher Elementary School, fell one notch to a ‘D’.
“We have some things to celebrate, and we have a number of things to work on”, ACS Superintendent Pamela Baldwin said on Tuesday. “Our district has already commenced an extensive analysis of the data and we have already implemented or will soon initiate new strategies to enhance teaching and learning. The extension of the elementary school day by 20 minutes is just one example.”
As required by state legislation, the School Performance Grades are based 80 percent on the school’s achievement score and 20 percent on students’ academic growth. Elementary and middle schools’ School Performance Grades are based only on test scores. These include end-of-grade reading and mathematics tests at the 3-8 grade levels; an end-of-grade science test at grades 5 and 8, and if applicable, end-of-course tests in Math I and Biology. All public schools, including charter, receive grades.
Superintendent Baldwin recently highlighted for the Asheville Board of Education other new or enhanced district initiatives, as administrators, teachers and staff collaborate to build excellence with equity across the 4,390-student district:
The district has just published a new strategic plan that focuses on three critical areas: Early Childhood, Academic Achievement and Whole Child and has Excellence with Equity at its core.
Central Office has hired several new leaders, reorganized department structures/locations and renewed the focus on Teaching and Learning.
Curriculum and Instruction will now revolve around Six Essentials: (Reading) academic vocabulary, close reading of text, writing with evidence; (Math) model with mathematics, make sense of problems and persevere in solving them, and construct viable arguments/critique reasons.
Other initiatives include: the expansion of AVID, a narrowed focus on teaching standards, de-tracking efforts, student voice initiatives, partnership expansions with AB-Tech and UNC Asheville and leadership support/mentoring.Here are the School Performance Grades for Asheville City Schools (as well as growth status):
Claxton Elementary —– C (did not meet growth)
Isaac Dickson Elementary — B (met expected growth)
Hall Fletcher Elementary — D (did not meet growth)
Ira B. Jones Elementary — B (met expected growth)
Vance Elementary —- B (met expected growth)
Asheville Middle School — C (did not meet growth)
Asheville High School — C (did not meet growth)
SILSA — A (exceeded expected growth)
And here is how those School Performance Grades align with socio-economic demographics when charted:The high school achievement score is based on student performance on Math I, English II and Biology end-of-course tests, and on the percentage of students who score 17 or above on The ACT (UNC System’s minimum composite score requirement), the percentage of students who achieve a Silver Certificate or better on the ACT WorkKeys, the percentage of students who successfully complete Math III, and the school’s four-year cohort graduation rate. About 90% of SILSA juniors and two-thirds of AHS juniors scored at least a 17 on the ACT.
Buncombe County Schools press release:
BUNCOMBE COUNTY SCHOOLS DEMONSTRATE GROWTH ON ANNUAL SCHOOL PERFORMANCE GRADES RELEASE
BCS Graduation Rate Up for Fifth Consecutive Year
September 2, 2015
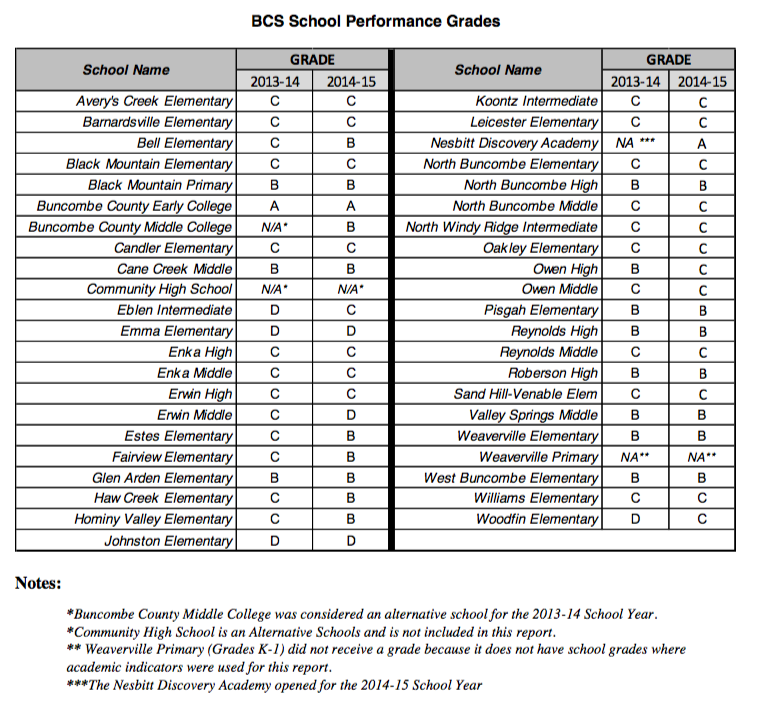
Buncombe County Schools had 92.7-percent of its schools earn grades of C or better on today’s release of North Carolina’s second annual school performance grades. This percentage compares to the state average of 72.2-percent for traditional public schools, and 70.4-percent for public charter schools. For the 5th consecutive year, BCS four-year cohort high school graduation rate has increased up. This year, BCS has an 85.1-percent graduation- an increase over last year’s 83.2-percent.
More specifically:
- All BCS High Schools earned a school performance grade of C or higher
- 91% of BCS elementary, intermediate, and middle schools achieved a grade of C or better
- This is an 87% increase from last year
- 7% of BCS Schools (3 schools- Emma Elem., Erwin Middle, Johnston Elem.) received a D performance grade
- Last year, 10% of BCS Schools earned a D
- No BCS schools received an F performance grade
- 16 BCS schools received a performance grade of B
- Last year, BCS had 11 schools earn a B
- Buncombe County Early College and the Martin L. Nesbitt Discovery Academy received a performance grade of A
- 9 BCS Schools achieved expected growth after not meeting expected growth last year
- 3 Schools Exceeded Expected Growth for two consecutive years (Emma Elementary, West Buncombe Elementary, and Valley Springs Middle)
“While we reaffirm our belief that no one letter grade can possibly describe the overall performance of a school, we have taken it to the next level and have broken these data down and are encouraged by the student achievement indicators- especially the continued increase in our graduation rates,” said Superintendent Dr. Tony Baldwin. “This is an ongoing process for our students and staff. As educators, we are taking this information and applying instructional strategies to help every child be successful.
“I absolutely believe Buncombe County Schools, overall, are heading in the right direction.”
Before you comment
The comments section is here to provide a platform for civil dialogue on the issues we face together as a local community. Xpress is committed to offering this platform for all voices, but when the tone of the discussion gets nasty or strays off topic, we believe many people choose not to participate. Xpress editors are determined to moderate comments to ensure a constructive interchange is maintained. All comments judged not to be in keeping with the spirit of civil discourse will be removed and repeat violators will be banned. See here for our terms of service. Thank you for being part of this effort to promote respectful discussion.