

N.C. Department of Public Instruction data for the 2015-16 school year show alarming gaps in academic proficiency between black students and all other racial groups.
Worse yet, those gaps are stubbornly persistent. Between 2009 and 2014, the system’s African-American students scored below the state average for black students in every subject and at every grade level, says Melissa Hedt, K-12 teaching and learning coordinator for the Asheville City Schools. “The same has not been true of any other subgroup of students,” she notes, when compared with their respective statewide averages, “including Hispanic, multiracial, economically disadvantaged, students with disabilities, and academically and intellectually gifted.”
More recently, some black students have outperformed their statewide peers. In 2014-15, Asheville’s black students surpassed the state averages in fourth-grade reading and seventh-grade math. And in 2015-16, black students bested their state averages in both seventh- and eighth-grade math. Nonetheless, says Hedt, “The overwhelming majority of our grade levels and subjects still experienced lower proficiency rates for black students. All our other subgroups outperform the state averages [for their group] in most grade levels and subjects.”
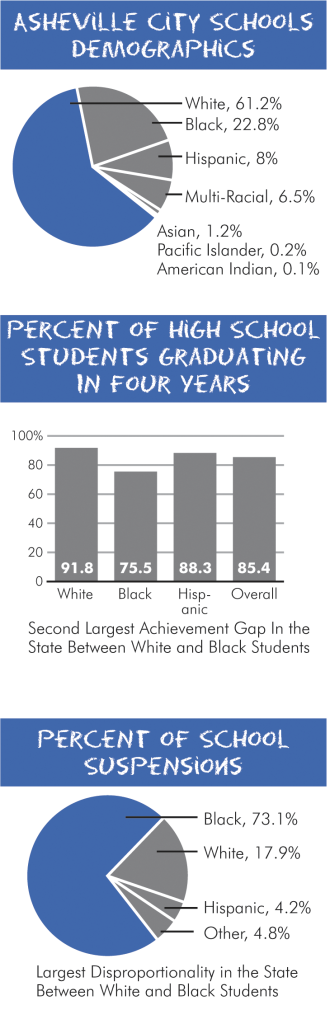
Based on 2014-15 data, the Southern Coalition for Social Justice’s Youth Justice Project ranked Asheville worst in the state in terms of the disparity between how its African-American and white students performed on end-of-grade and end-of-course exams. This was true for local students in grades three through eight and in high school. Meanwhile, in direct comparisons between African-American and white students, the city schools had the greatest racial disparity in rates of short-term suspensions, measured as a percentage of the student population versus the number of suspensions. Finally, Asheville’s disparity in graduation rates ranked second-worst.
Before you comment
The comments section is here to provide a platform for civil dialogue on the issues we face together as a local community. Xpress is committed to offering this platform for all voices, but when the tone of the discussion gets nasty or strays off topic, we believe many people choose not to participate. Xpress editors are determined to moderate comments to ensure a constructive interchange is maintained. All comments judged not to be in keeping with the spirit of civil discourse will be removed and repeat violators will be banned. See here for our terms of service. Thank you for being part of this effort to promote respectful discussion.