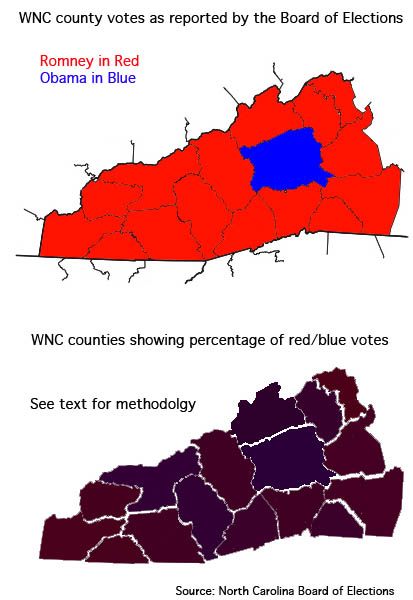
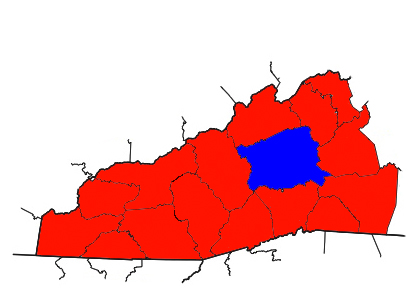
If you look at the website of the N.C. Board of Elections, you would think that the people of Buncombe County were the only ones in Western North Carolina who voted for Obama for president. Buncombe county looks like island of blue in a sea of red.
Here are the numbers from the state for each of the 16 counties shown on the map.
| County | Obama/Biden | Romney/Ryan | Percentages Dem/GOP |
| Cherokee County | 3339 | 9201 | 26/72 |
| Graham County | 1115 | 2743 | 28/69 |
| Clay County | 1573 | 3952 | 28/70 |
| Macon County | 5692 | 10817 | 33/64 |
| Swain County | 2618 | 2976 | 45/51 |
| Haywood County | 11795 | 15599 | 42/55 |
| Jackson County | 8052 | 8224 | 48/49 |
| Transylvania County | 6740 | 9522 | 41/58 |
| Henderson County | 18519 | 32860 | 35/63 |
| Buncombe County | 70066 | 54429 | 55/42 |
| Madison County | 4466 | 5379 | 44/53 |
| Yancey County | 3954 | 5249 | 42/55 |
| Mitchell County | 1810 | 5778 | 23/75 |
| McDowell County | 6006 | 11732 | 33/66 |
| Polk County | 4000 | 6219 | 38/60 |
| Rutherford County | 9277 | 18797 | 32/66 |
| Note: Some county totals do not add to 100 due to write-in votes and 3rd party votes. | |||
The numbers from the yet unofficial vote tallies were used to make this map. For each county, the red value (for example in Cherokee County 72) and the blue value (again for Cherokee, 26) were mixed in photoshop to create a purple. As you can see, some counties are red-purple and some are blue-purple.
Averages in the 16-county area come out to 37 percent for Obama and 60 percent for Romney, significantly above the state averages reported (48 percent for Obama/Biden and 50 percent for Romney/Ryan).


For all the counties shown, Obama got 159,022 votes, or 43.9%, while Romney got 203,477, from a total of 362,499 votes. This is a much better summation of how WNC voted, rather than averaging the county shares to compare with the state total.
All you have really accomplished with this is to highlight just how divided and sectarian this country has become.