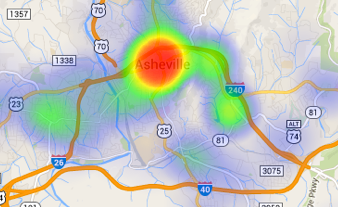
Where were Asheville’s “hot spots” for brick-and-mortar businesses in 2014? Despite ample buzz about growth in downtown’s South Slope, local development was surprisingly modest, according to an Xpress analysis of city data.
A heat map created by Xpress Web developer Kyle Kirkpatrick shows that downtown areas just north of Patton Avenue have been 2014’s most dense hot spots. Small but noticeable pockets of development are also evident on West Asheville’s Haywood Road, Merrimon Avenue, Tunnel Road, and Highway 25 near Biltmore Forest, Overlook Road and Sweeten Creek.
The heat map aggregates business license data provided by the city of Asheville — specifically, new privilege licenses granted to 240 companies in dozens of business categories throughout 2014. Areas of the most highly concentrated development appear as red-colored zones, while less active districts are shades of blue, green and yellow.
“That’s a unique data set,” says Dave Michelson, Asheville’s geographic information systems analyst, of the business license records. “A lot of the data we collect gets driven by the legal addresses that we use for 911, but for some reason the business license software doesn’t tie into that address list. … It’s not as strict.”
Michelson is charged with making sense of imperfect data sets quite often.
“There’s always value,” he says. But limitations in the data “just makes it harder to do the analysis.”
“Visualizing data is a real focus in the mapping world today,” adds Bruce Daniel, creator of The Asheville Map. “The best maps are built on data that is curated with a sense of purpose, not simply the biggest data set or highest granularity.”
Heat maps attempt to achieve this artful functionality by abandoning minutia in favor of overarching insight.
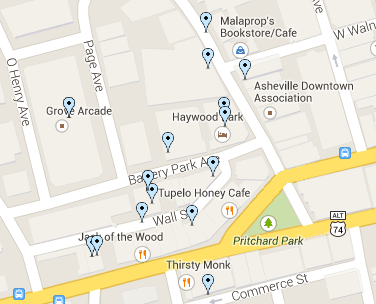
For the second interactive map, Xpress plugged those 240 businesses into a Google platform that allows readers to filter companies by license category. Roughly 40 percent of records represented retail businesses and 27 percent indicate restaurants. Notably, a relatively dense cluster of retail shops can be seen near Battery Park Avenue’s short stretch. (Click the image below to check out the interactive map, color-coded based on license categories.)
“But data isn’t the only determinant of a successful map,” says Daniels. “Cartography still combines art with science, and all too often I see maps that are lacking the former.”

METHODOLOGY
The city of Asheville provided 1,030 license records granted from Jan. 1, 2014 through Dec. 29, 2014, with many businesses accounting for multiple licenses. In order to convey location-specific insight, Xpress deleted records reflecting service industries — from dozens of new adult entertainers to a handful of plumbers — and itinerant retailers (e.g. market vendors and food trucks). Wholesalers, whose location often doesn’t indicate place of product consumption, were pulled out, as were duplicate records and businesses registered outside of Asheville. Some 240 records comprise the final data set.
Following is a list of license categories and whether they appear on the heat map. Note: many industries do not require any privilege license.
| Categories included in map: |
Categories omitted from map: |
| Auto Dealer | Adult Entertainer |
| Auto Parts Retail | Auto Parts Wholesale |
| Auto Services/Supplies | Automatic Sprinklers |
| Barber Shop/Beauty Salon | Certificate of Necessity |
| Beer Off Premise | Electricians |
| Beer On Premise | Employment Agency |
| Chain/Branch Store | Itinerant Merchant |
| Exempt | Licensed General Contractor |
| Hotels/Motels/B&B | Loan Agency/Broker |
| Ice Cream | Mechanical Contractor |
| Laundries | Plumbers |
| Manufacturer | Refrigeration Contractor |
| Mobile Home Dealer | Service |
| Restaurant 0-4 Seats | Specialty Market Vendor |
| Restaurant 5+ Seats | Taxi for Hire Driver |
| Retail | Wholesale |
| Sundries | |
| Wine Off Premise | |
| Wine On Premise |
For the purpose of color-coding the categorized Google map, Xpress assigned multilicense businesses one lead category and included additional categories in each business’ description (viewable when pins are clicked in the interactive map).
LIMITATIONS
Privilege license addresses are one way to track brick-and-mortar business development geographically. The measured growth, however, doesn’t reflect new business entities in cases when an existing company adds a new product or service line that requires a privilege license. An existing winery, for example, would require a new privilege license to begin selling spirits, which may indicate a different type of business growth.
Businesses expanding by moving into a larger space wouldn’t appear on the map (although they may indicate growth areas), since a simple change of address allows the company to forgo a new privilege license application. All data is subject to human error in collection and subsequent manipulation.


There is a quote attributed to Daniels. This person is not mentioned otherwise in the article. Who is this?
Thank you! Two paragraphs were hidden due to embedding the image. It’s fixed now, and that would be Bruce Daniel, creator of The Asheville Map, that you’re referring to.